ClusDOCK Tutorial 2
a tool for cluster analysis of docked poses
This example will guide a new user through a cluster analysis using ClusDOCK.
For this tutorial, we will perform the clustering of docking results obtained from the "re-docking" of the cmplex between a minor groove binding drug, netropsin, and the DNA dodecamer d(CGCGATATCGCG) with a resolution of 2.4 Å (PDB code: 1DNE).
The ligand (netropsin) has been separated from the complex structure of the target, and then docked back into the target using the docking programme HYBRID (OpenEye).
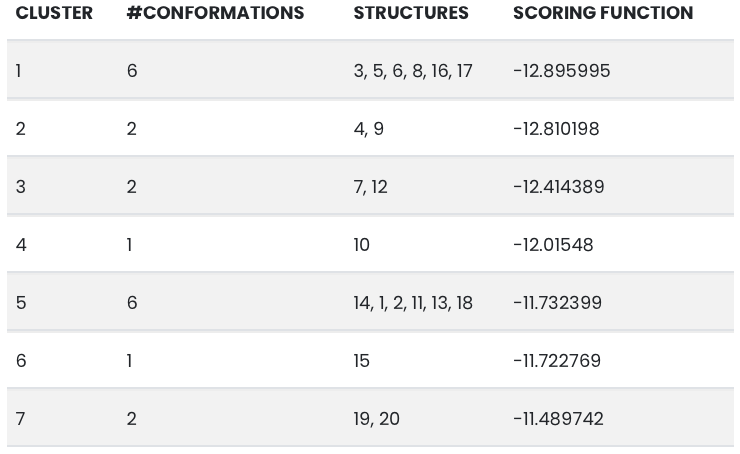
The docking programme output is composed of 20 poses of the ligand.
This file will be used as our input to perform the clustering of the predicted poses of the ligand.
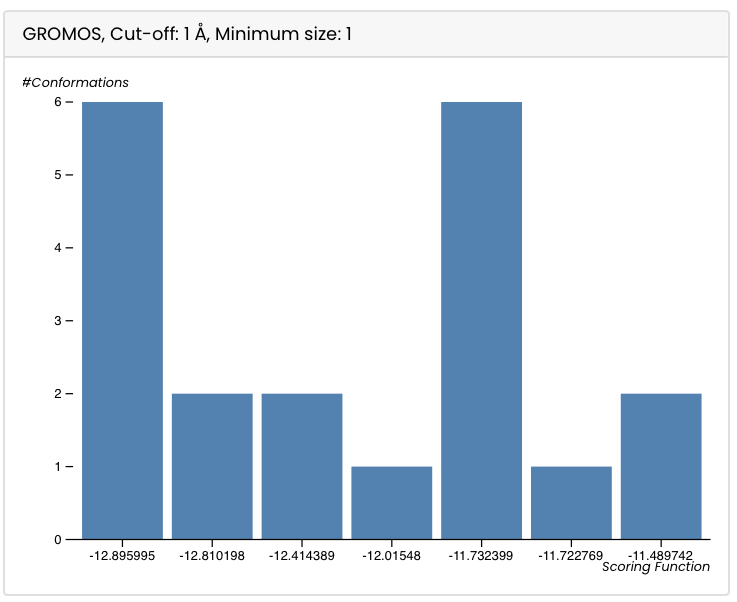
The bar plot shows on the y-axis the number of conformations for each cluster and on the x-axis the scoring function (determined by the docking programme) for each cluster.
> For more information about ClusDOCK and how to interpret the results, see ClusDOCK Documentation.
- Download the input file: click on the file to download it
- Input file generated by the docking programme: Netropsin_20_poses.sdf
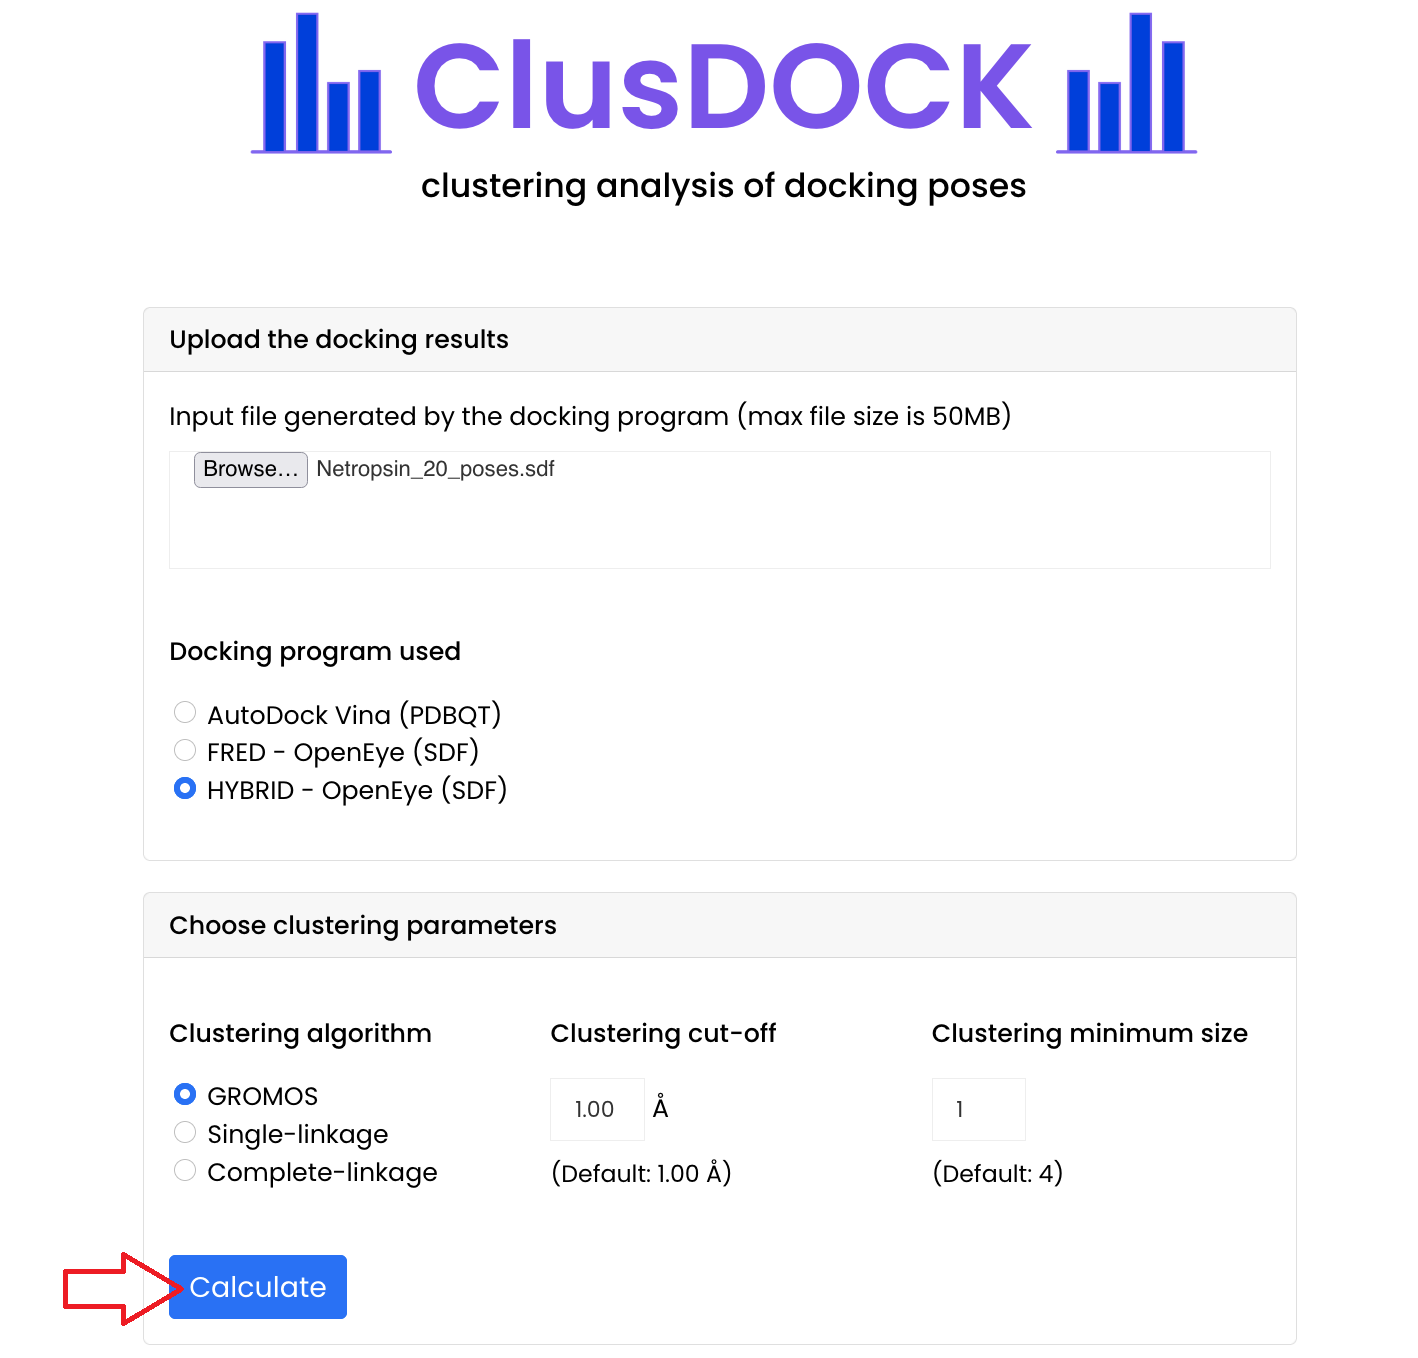
- Upload this file in the "Upload the docking results" section of the ClusDOCK tool
Click on "Browse..." and select it or drag it in the box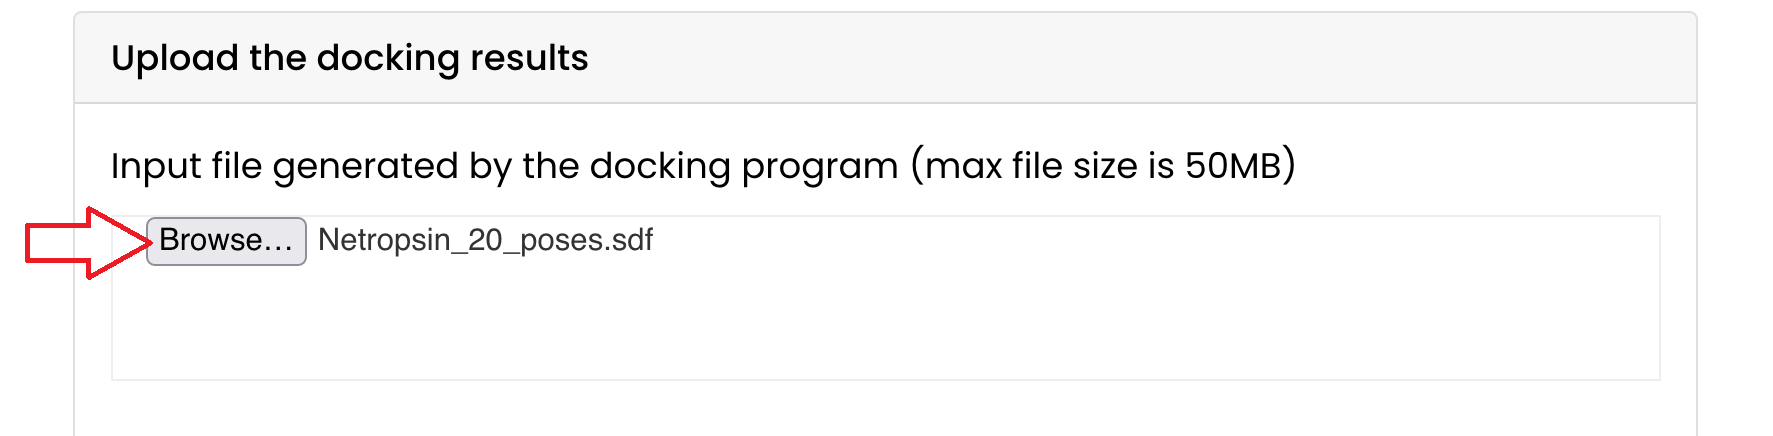
- Choose the docking programme used: for this tutorial we have used HYBRID, thus select the
"HYBRID - OpenEye (SDF)" button
If you want to cluster docking results obtained with AutoDock Vina or Fred - OpenEye, click on their respective button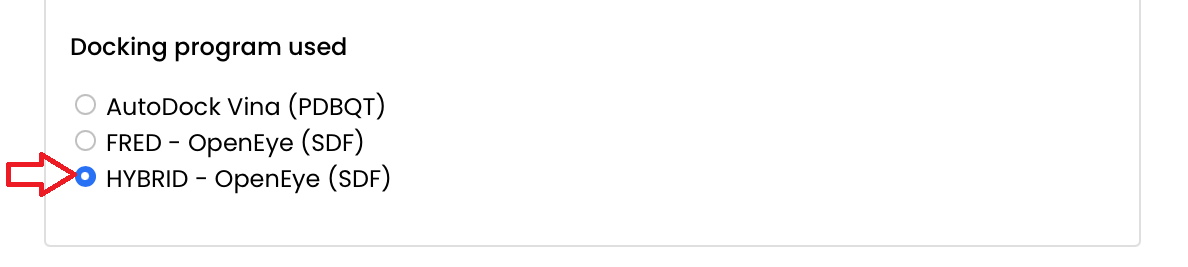
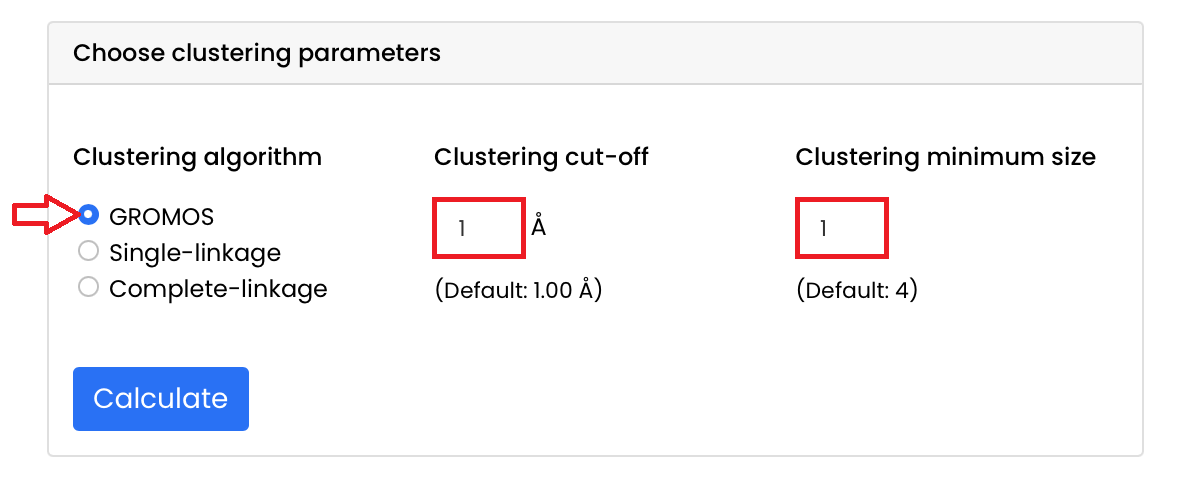
- Choose the clustering parameters:
- Choose the clustering algorithm: for this tutorial we will use the GROMOS algorithm, thus select the "GROMOS" button
If you want to use the single-linkage algorithm or the complete-linkage algorithm, click on their respective button - Choose the clustering cut-off: for this tutorial we will use a cut-off of 1 Å, thus enter this value in the "Clustering cut-off" box
If you leave this box empty, then the default value of 1 Å is considered - Choose the clustering minimum size: for this tutorial we will use a clustering minimum size of 1, thus enter this value in the "Clustering minimum size" box
If you leave this box empty, then the default value of 4 is considered
- Choose the clustering algorithm: for this tutorial we will use the GROMOS algorithm, thus select the "GROMOS" button
- Run the cluster analysis by clicking the "Calculate" button